The problem
Stock levels lived in one spreadsheet, sales in another, and the two only agreed if somebody remembered to reconcile them. By the time a discrepancy surfaced it was usually weeks old and nobody could say which entry was wrong.
A mini ERP for inventory and sales — stock tracking, sales records and Highcharts reporting.
Visit the live site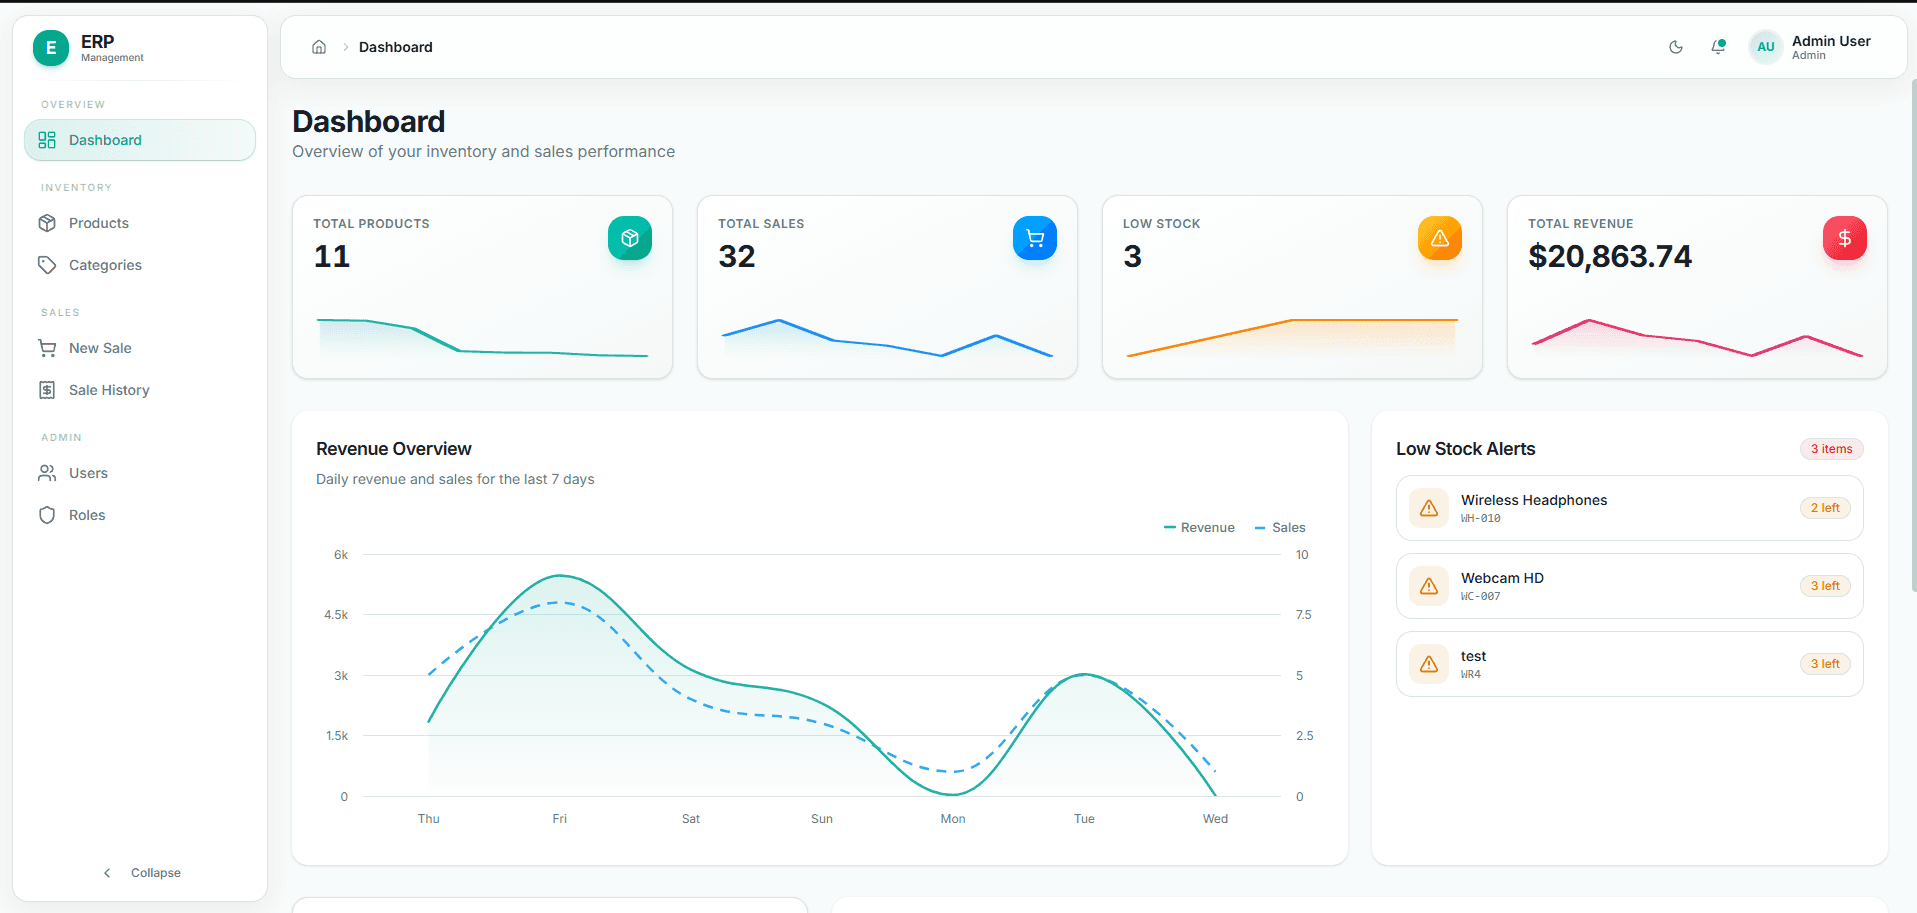
Built with
Stock levels lived in one spreadsheet, sales in another, and the two only agreed if somebody remembered to reconcile them. By the time a discrepancy surfaced it was usually weeks old and nobody could say which entry was wrong.
Built the React front end — stock tracking, sales entry and the reporting views — against the API, including the Highcharts reporting layer.
Stock movements are recorded as events rather than as a mutable quantity per item. A running total you overwrite has no history, so when it disagrees with the shelf there is nothing to audit; a ledger you sum can always be replayed to find the entry that broke.
Reporting uses Highcharts rather than a hand-rolled chart layer because the requirements were ordinary — time series, category breakdowns, drill-down — and building that from scratch would have been weeks spent reproducing a solved problem.
Data entry is the screen staff use hundreds of times a day, so it is keyboard-first and validates in place rather than on submit.
Running in production at erp.softqare.com as the inventory and sales system, with stock and sales reconciled against one source instead of two spreadsheets.
Tell me what you are trying to ship and where it is stuck. I reply to everything within a day.
+8801751073892